
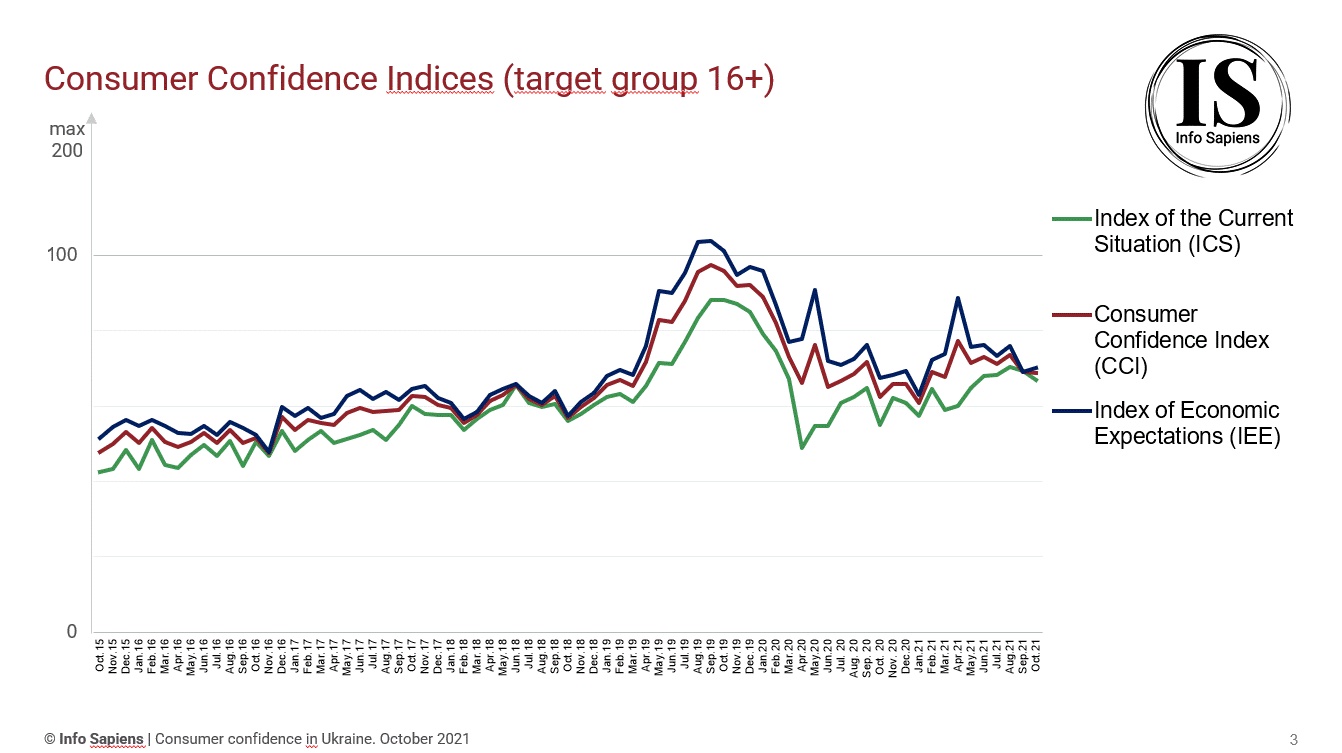
According to the data provided by Info Sapiens “Consumer confidence of Ukrainians”, conducted by Info Sapiens and financially supported by Dragon Capital, in October, 2021, the Consumer Confidence Index of Ukrainians has decreased and equals 68.8 points. A decrease in the indicator was caused by the decline in the Index of Propensity to Consume, which decreased in the current month by 5,4 p.
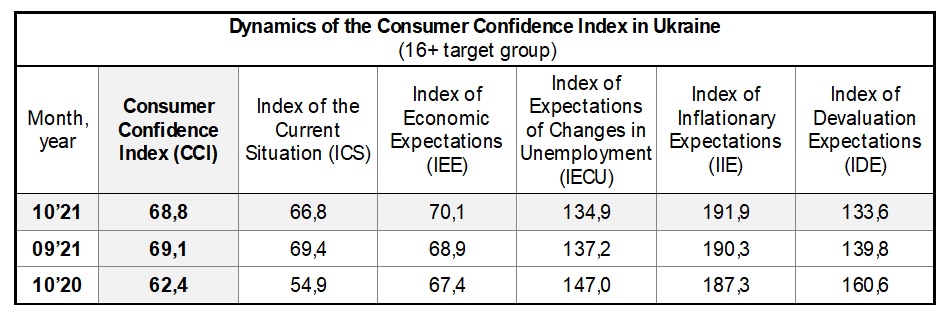
In October 2021, the Consumer Confidence Index (CCI) equals 68,8, which is 0.3 points lower than the indicator in September.
Index of the Current Situation (ICS) have decreased and equals 66.8, which is 2.6 p. lower than in September. The components of this index have changed as follows:
- – Index of Current Personal Financial Standing (х1) equals 59.7, which is 0.2 points higher than the indicator in September;
- – Index of Propensity to Consume (х5) decreased by 5.4 p. to the level 73.9.
In October, Index of Economic Expectations (ІЕE) have increased and equals 70.1, which is 1.2 p. higher that the level of this indicator in September. The components of this index have changed as follows:
- – Index of Expected Changes in Personal Financial Standing (х2) equals 72, which is 3.8 points higher than in September;
- – Index of Expectations of the Country’s Economic Development Over the Next Year (х3) in October equals 61.1, which is 1.5 points lower than in previous month;
- – Index of Expectations of the Country’s Economic Development over the Next 5 Years (х4) increased by 1.4 points compared to last month and equals 77.3.
In September, the indicator of Index of Expectations of Changes in Unemployment has decreased by 2.3 points and equals 134.9. Index of Inflationary Expectations increased by 1.7 points and equals 191.9. Expectations of Ukrainians regarding the hryvna’s exchange rate in the coming three months have improved: Index of Devaluation Expectations decreased by 6.2 p. and equals 133.6.
«In general, we do not observe any significant changes in October compared to this September. Yet, all major indices improved compared to last October, except for Inflationary Expectations. Consumer Confidence Index increased by 6.4 points YoY. Ukrainians also became more confident in national currency: Index of Devaluation Expectations has decreased by 27 points YoY.» - as Info Sapiens analysts comment.
How the indices are calculated
The survey «Consumer confidence in Ukraine» was conducted by GfK Ukraine since June 2000. From 2019 this project is provided by Info Sapiens. From January 2009 consumer confidence survey is conducted on a monthly basis.
In Ukraine. the Consumer Confidence Index is determined through a random survey of domestic households. The poll involves 1.000 individuals aged 16+. (Up to April 2014 the poll involved 1.000 respondents aged 15-59). A representative sample is selected by gender and age, also by type and size of settlement. In April 2014 Autonomous Republic of Crimea was excluded from the sample of consumer confidence research in Ukraine. The margin of error is 3.2%. In April and May 2020, the survey was conducted via CATI method with calls on mobile phones. Dates of the latest survey: July 3-29.
To define the CCI, respondents are asked these questions:
- 1. How has the financial standing of your family changed over the last six months?
- 2. How do you think your family’s financial standing will change in the next six months?
- 3. Looking at economic conditions in the country as a whole, do you think the next 12 months will be good or bad?
- 4. Looking at the next five years, will they be good ones or bad ones for the country’s economy?
- 5. In terms of large purchases for your home, do you think now is generally a good time or a bad time to make such purchases?
- • index of Current Personal Financial Standing (x1);
- • index of Expected Changes in Personal Financial Standing (x2);
- • index of Expected Economic Conditions in the Country Over the Next Year (x3);
- • index of Expected Economic Conditions in the Country Over the Next 5 Years (x4);
- • index of Propensity to Consume (x5).
- • consumer Confidence Index (CCI) as the arithmetic average of indices x1–x5;
- • index of the Current Situation (ICS) as the arithmetic average of indices x1 and x5;
- • index of Economic Expectations (IEE) as the arithmetic average of indices x2, x3, and x4.
- 1. Do you think that within next 12 months the number of unemployed (people who do not have job and are looking for work) will increase, will remain roughly the same, or will decrease?
- 2. How do you think that prices for major consumer goods and services will change in the next 1–2 months?
- 3. How do you think the USD value will change towards the UAH value during the next 3 months?
Each of these questions is related to a corresponding index:
Indices are constructed thus: the share of negative answers is deducted from the share of positive answers, and 100 is added to this difference in order to eliminate negative values. On the basis of these five indices, three aggregate indices are calculated:
Index values range from 0 to 200. The index equals 200 when all respondents positively assess the economic situation. It totals 100 when the shares of positive and negative assessments are equal. Indices of less than 100 indicate the prevalence of negative assessments. To determine the Index of Expected Changes in Unemployment (IECU), the Index of Inflationary Expectations (IIE) and the Index of Devaluation Expectations (IDE), the respondents are asked these three questions:
The IECU, the IIE and the IDE are calculated thus: the share of answers that indicate a decrease of unemployment/inflation/devaluation is subtracted from the share of answers that indicate the growth of unemployment/inflation/devaluation, and 100 is added to the difference to eliminate negative values. The values of indices can vary from 0 to 200. The index totals 200 when all residents expect an increase in unemployment/inflation/devaluation.